Three High-Level Metrics to Gauge the Health of Your Construction Business
These measurements, based on total revenue, can help predict and project the health of your construction business.

There’s an old cliche, “What gets measured gets done.” Measuring something gives you the information you need in order to make sure you actually achieve what you set out to do.
For a construction company, the easiest metric to determine is Total Revenue. Even if your bookkeeping is in rough shape, most business owners know their Total Revenue.
Total Revenue is the sum of all the work for which you have billed for a given period of time. This metric alone will not tell you much about the overall health of your business.
For example, you can have a high total revenue but a low net profit. This is not good.
But you can use the Total Revenue number to develop 3 High Level* metrics.
*High Level Metric – a key performance indicator (KPI) that is easy to calculate and does not require a deep financial analysis to produce.
These High Level metrics can help predict and project the health of your construction business.
KPI #1 – Revenue Per Employee
As a construction company grows from owner-does-it-all to owner-hires-employees, the predictive metric of Revenue Per Employee (RPE) can be used to gauge production levels, labor efficiency, and scheduling.
To calculate the RPE for your business, divide the Total Revenue by the Total Number of Production Employees. A Production Employee is an employee whose primary function is to put work in place.
RPE = TOTAL REVENUE / # of PRODUCTION EMPLOYEES
Overhead employees such as office administration, project managers, estimators, or owners would not be considered Production Employees.
Business owners that spend a majority of their working hours producing field work would be considered Production Employees to calculate an accurate RPE.
Example:
The RPE for a construction company where the owner is also the Lead Carpenter and employs two other carpenters (possibly Support and Apprentice carpenters) and installs $750,000 worth of work per year would be as follows:
RPE per year = $750,000 / 3 = $250,000
Your company can use this KPI to establish the production capacity of your labor force. This KPI will vary throughout the year depending on several factors, but establishing a baseline RPE will help project the future labor required as your company grows or as your workload shrinks.
Assume that the RPE for your company is $250,000 and you have booked $95,000 worth of work to in place in the next 6 weeks. You can quickly calculate whether you can meet that goal with your current workforce.
RPE per year = $250,000 (based on historical data)
RPE per week = RPE per yr / Weeks per yr = $250,000 / 52 = $4,807.69 RPE per week
Estimated RPE generated in 6 weeks = $4,807.69 x 3 Production Employees x 6 weeks
Estimated RPE generated in 6 weeks = $86,538.42
If your Estimated RPE for 6 weeks is $86,538.42 and your project requires $95,000 to be installed, then you will have to increase your production capacity by about 10% or hire additional labor to complete the project on time.
Job Revenue in 6 weeks / Estimated RPE for crew size for 6 weeks
$95,000 / $86,538.42 = 1.098
or
Approximately a 10% increase in production capacity per employee.
By tracking this KPI over time, you will be able to determine the sweet spot of your production capacity and predict your staffing needs.
Note: This is a High Level metric and should not be used as a basis for individual employee performance evaluations.
KPI #2 – Average Weekly Billing
Most complex processes can be broken down into smaller, manageable tasks. The specific ways in which your company generates revenue will most likely come from different income streams. The sum of these income streams is your Total Revenue. You should break down your projected Total Revenue into a KPI called Average Weekly Billing (AWB) to gauge the overall progression toward your budgetary goals. If your goal is to generate a projected Total Revenue of $750,000, then you must bill and receive an AWB of $14,423.08 each week throughout the year. This KPI is easily calculated using the projected Total Revenue.
AWB = Projected Total Revenue / 52 weeks
Example:
AWB = $750,000 / 52 weeks = $14,423.08 per week
Even if you don’t bill your clients weekly, you should still calculate your AWB in order to know when you are ahead of your goal and when you are lagging.
Tracking this simple metric will reveal much about the ebb and flow of your business throughout the year. You can easily predict when cash will be tight and when you may have more breathing room.
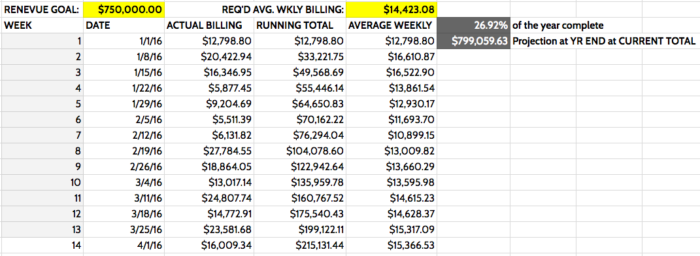
The picture below is a simple spreadsheet that calculates the AWB using Actual Weekly Billing and the Running Total.

With this information tracked, you can also calculate the percentage completion of the year and a projection of Total Revenue for the year at the current week.
In this example, the table shows the data for the first fourteen weeks of 2016. The percentage completion of the year is a simple ratio of current week of the year to the total number of weeks in a year.
% Completion of the Year = Current number of weeks / # of weeks per yr x 100%
% Completion of the Year = 14 / 52 x 100% = 26.92%
And you can use the current total to project the Total Revenue at year’s end based on the percentage of completion of the year.
Projected Total Revenue at Year End = Current Total / % Completion of the Year
Projected Total Revenue at Year End = $215,131.44 / 26.92% = $799,059.63
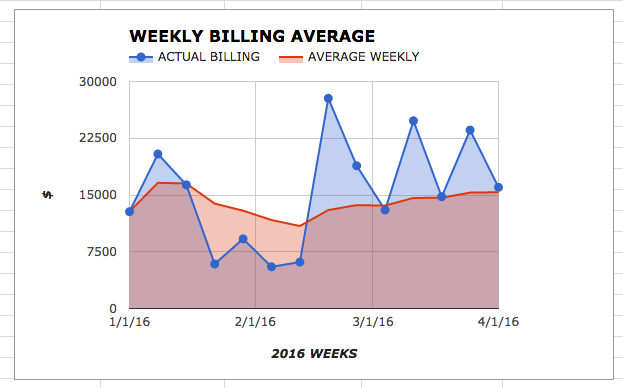
Below is a graph that shows how the Actual Weekly Billing effects the Average Weekly Billing.

USING KPI #1 and KPI #2 TOGETHER
After you calculate your Projected Total Revenue at Year End, you can determine your staffing needs based on the RPE you are developing.
In this example, the RPE is $250,000.
The Projected Total Revenue at Year End is $799,059.63 (from the example above).
Employees needed = Projected Total Revenue at Year End / RPE
Employees needed = $799,059.63 / $250,000 = 3.2
This 0.2 might not seem like much, but it represents 20% of an employee, or an additional 8 hours per week. If one of your employees works this additional 8 hours per week (20% of 40 hours), then you may have to pay overtime. This cold affect your Cost of Goods Sold, which in turn, may affect your Net Profit.
You may solve this problem by hiring some part-time help. You could also decide that you want to bring on an additional full-time employee. If you increase your crew size from 3 employees to 4, then (assuming the RPE is the same) your new projected Total Revenue will be $1,000,000 with an AWB of $19,230.77. Only the business owner can decide which course is best to pursue, but developing these High Level metrics will inform these decisions.
KPI #3 – Closing Rate
Tracking your Closing Rate is one of the most effective High Level metrics you can determine. The Closing Rate is a ratio of the Actual Projects you perform to the Total Projects Proposed.
Closing Rate = Actual Projects / Total Projects Proposed x 100%
As a starting point, I recommend using the dollar value of the Actual Projects versus the Total Projects Proposed from the previous year to determine your closing rate. This will yield a more accurate prediction of the action you need to take to hit your production and budgetary goals. (See my post Document Control to Business Control on how to determine an accurate Closing Rate for your company.)
Example:
If your Closing Rate is 35%, then you are awarded just over one third of the jobs you propose (based on the dollar amount). If your projected Total Revenue is $799,059.63 (from the example above), then you will have to propose $2,283,027.51 in order to realize your projected Total Revenue.
Closing Rate = 35%
Total Projected Revenue = $799,059.63
Total Projects Proposed for this year in $ = Total Projected Revenue / Closing Rate
Total Projects Proposed for this year in $ = $799,059.63 / 0.35 = $2,283,027.51
If we use a page out of the AWB playbook, then you will need to propose an average of $190,252.30 worth of work each month to hit your goals.
Monthly Proposed Projects in $ = Total Projects Proposed for this year in $ / 12 months
Monthly Proposed Projects in $ = $2,283,027.51 / 12 = $190,252.30
In other words, you will need to look at nearly $190,000 worth of work per month at a Closing Rate of 35% to realize $799,059.63 in actual revenue. Each of the KPIs listed here do not take a lot of time to develop and should be easy to generate.
Start with your Total Revenue.
Develop a process to track and a frequency at which you will evaluate and analyze each of these KPIs. Add information as it becomes available. When you do this, you will have a better understanding of the overall health of your business and the areas that need attention.
Remember. “What gets measured gets done.”
Follow me on Instagram @shawnvandyke, LinkedIn, Facebook, or shawnvandyke.com to learn more about how to streamline your construction business.


