Exploring the Nation’s Metropolitan Areas
With their relatively high population densities, home values, and per-capita income averages, the nation’s 35 largest metropolitan areas accounted for 54% of remodeling activity over the past decade, according to “A New Decade of Growth for Remodeling,” an analysis by the Joint Center for Housing Studies of Harvard University.
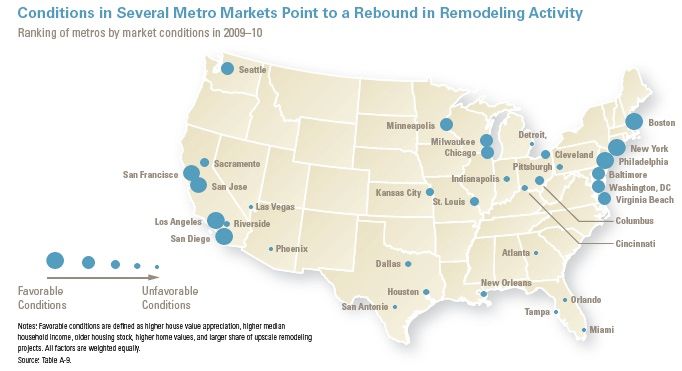
Because the level of remodeling activity varies widely among these 35 metros, however, the analysis looks at the demographics and regional factors that have affected improvement spending locally, and, based on 2009-2010 market conditions, offers a mostly positive outlook for several of these metros.
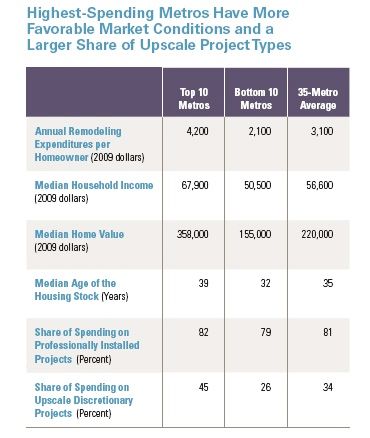
Part 4 of the study, titled “Metropolitan Perspectives,” highlights three variables: household income and wealth; home value; and the age of the housing stock. The 10 metros with the highest household-income medians, for example, spent almost a third more – about $900 – annually on remodeling than the 35-metro average: $3,100. Household income among the 10 highest-spending metros – which in the previous decade included San Jose, California; San Francisco, and Washington, D.C. – averaged $73,800 in 2009, whereas the income average that year for the 35 largest metros was $56,600.
Market value and the age of the inventory
Home value among the top 35 metros, meanwhile, played its traditional role as an incentive for homeowners to spend on maintenance or enhancements: over the past decade, $4,100 annually in the 10 markets with the highest home values versus $2,400 among the 10 metros that had the lowest home values. Annual improvement spending in metros whose housing stock tends to be older (areas in the Northeast and Midwest) averaged $3,300 per household, while metros with the newest housing stock (those in the West and South, including Dallas, Orlando, and Las Vegas) averaged $2,400, the JCHS analysis showed.
The percentage of households undertaking remodeling projects was nearly the same among the 10 highest-spending metros (with 58% of households reporting remodeling activity) and 10 the lowest-spending metros (56%). The difference in spending averages, though, was indeed significant: $7,400 for the 10 biggest spenders, which was 94% higher than the average for the 10 lowest spenders, or $3,700.
Among the top 35: the highest-spending, and lowest-spending, markets
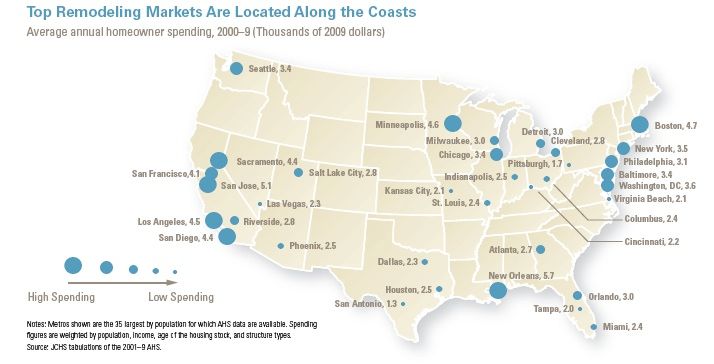
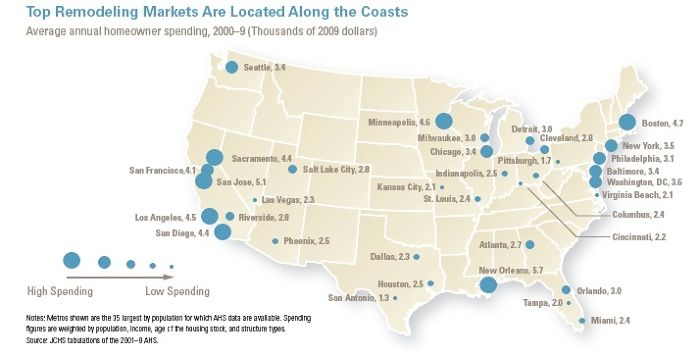
The high-spending metros (and their average annual remodeling expenditures, in 2009 dollars and in descending order): New Orleans ($5,700), San Jose ($5,100), Boston ($4,700) Minneapolis ($4,600), Los Angeles ($4,500), Sacramento ($4,400), San Diego ($4,400), San Francisco ($4,100), Washington, D.C. ($3,600), and New York ($3,500).
The low spenders: San Antonio ($1,300); Pittsburgh ($1,700); Tampa ($2,000); Kansas City ($2,100); Virginia Beach ($2,100); Dallas ($2,300); Las Vegas ($2,300); Columbus, Ohio, Miami, and St. Louis (all at $2,400); and Houston, Indianapolis, and Phoenix (all at $2,500).
Not surprisingly, the analysis shows that high-end discretionary remodels accounted for a big chunk of spending among the 10 highest-spending metros (45% of total expenditures) but a relatively modest amount of spending (26% of the total) among the 10 lowest-spending metros.
Price appreciation and other drivers of improvement-spending
Because markets that avoided price surges during the bubble saw fewer delinquencies (9% to 13%) than metros that surged during the boom (where delinquency rates would eventually rise as high as 39%), they also, over the entire decade, saw steadier growth in remodeling activity – an average of 22% among several metros including Dallas, Houston, and Pittsburgh.
The JCHS analysis suggests that markets in the Northeast and West will be particularly open to remodeling that focuses on energy efficiency upgrades, a project category that in most cases took the smallest hit during the downturn, in part due to federal tax credits and homeowner motivation to offset rising energy costs.
Overall, the JCHS says, remodeling prospects are expected to track upward over the next few years in all but the most overbuilt markets, but especially in traditionally high-spending areas and in metros such as Baltimore, Chicago, Milwaukee, and Chicago, which feature the three elements noted above: relatively high household incomes, aging housing stocks, and still-decent levels of home value.
More in this Series:
Even with Recent Declines, the Remodeling Market is Nearly $300 Billion
The Remodeling Industry’s Drift Toward Consolidation
Distressed Property Opportunities
Fine Homebuilding Recommended Products
Fine Homebuilding receives a commission for items purchased through links on this site, including Amazon Associates and other affiliate advertising programs.

Affordable IR Camera

Handy Heat Gun

8067 All-Weather Flashing Tape
